Source type: Ships, airguns, seismic surveys, explosions, wind
Model output: Source-specific sound maps for sound pressure level (SPL) and sound exposure level (SEL)
Description:
The European Union’s Marine Strategy Framework Directive (MSFD) requires EU member states to achieve or maintain Good Environmental Status (GES) by 2020. Specifically, GES Descriptor 11 requires underwater noise to be “at levels that do not adversely affect the marine environment”. The sound maps are practical tools to monitor and evaluate GES.Based on the tools that are freely available in our toolbox, the sound maps can be calculated to assess the impact of sound on marine life, including include spatial, temporal and spectral distribution. Earlier versions of these algorithms are developed during the PhD thesis at the University of Leiden [1]. Then, further improvements continued at TU Delft. Depending on the map type, sound sources can be considered individual (i.e., individual explosion, seismic airgun shot, AIS-based ship data) or based on the source density (i.e., shipping density, seismic shot density). The propagation models are optionally chosen as normal mode theory (adiabatic or coupled), mode-flux theory, parabolic equation, or wavenumber integration method. These maps are available in different metrics as sound pressure level (SPL) or sound exposure level (SEL).
Examples:
Soprano and Mezzo-Soprano propagation modelling tools are used to calculate the propagation loss with similar accuracy to adiabatic normal mode methods without requiring the long calculation times and computation power[3]. This computational advantage, which is critical for the sound mapping, enables calculating the sound maps for a large number of sources and receivers in a wide frequency band. The following video shows the North Sea shipping sound maps based on AIS data with 30 minutes resolution. The frequency range is 100 Hz to 100 kHz. In total, 1488 time-snapshots are used. Each snapshot contains hundreds of the ships.
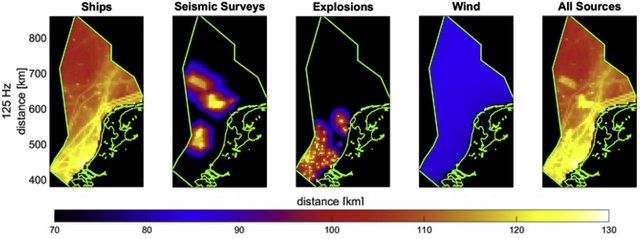
The averaging time of the sound maps can be chosen depending on its application. Annually averaged sound maps are calculated for the Dutch North Sea by [Sertlek et al., 2019]. According to this research, shipping makes the largest contribution to the energy budget (~1800 J), followed by seismic surveys (~300 J), explosions (~20 J) and wind (~20 J) in the frequency band between 100 Hz and 100 kHz. In the following figure, annually-averaged sound maps for the Dutch North Sea are shown for the different sound sources[1,2]
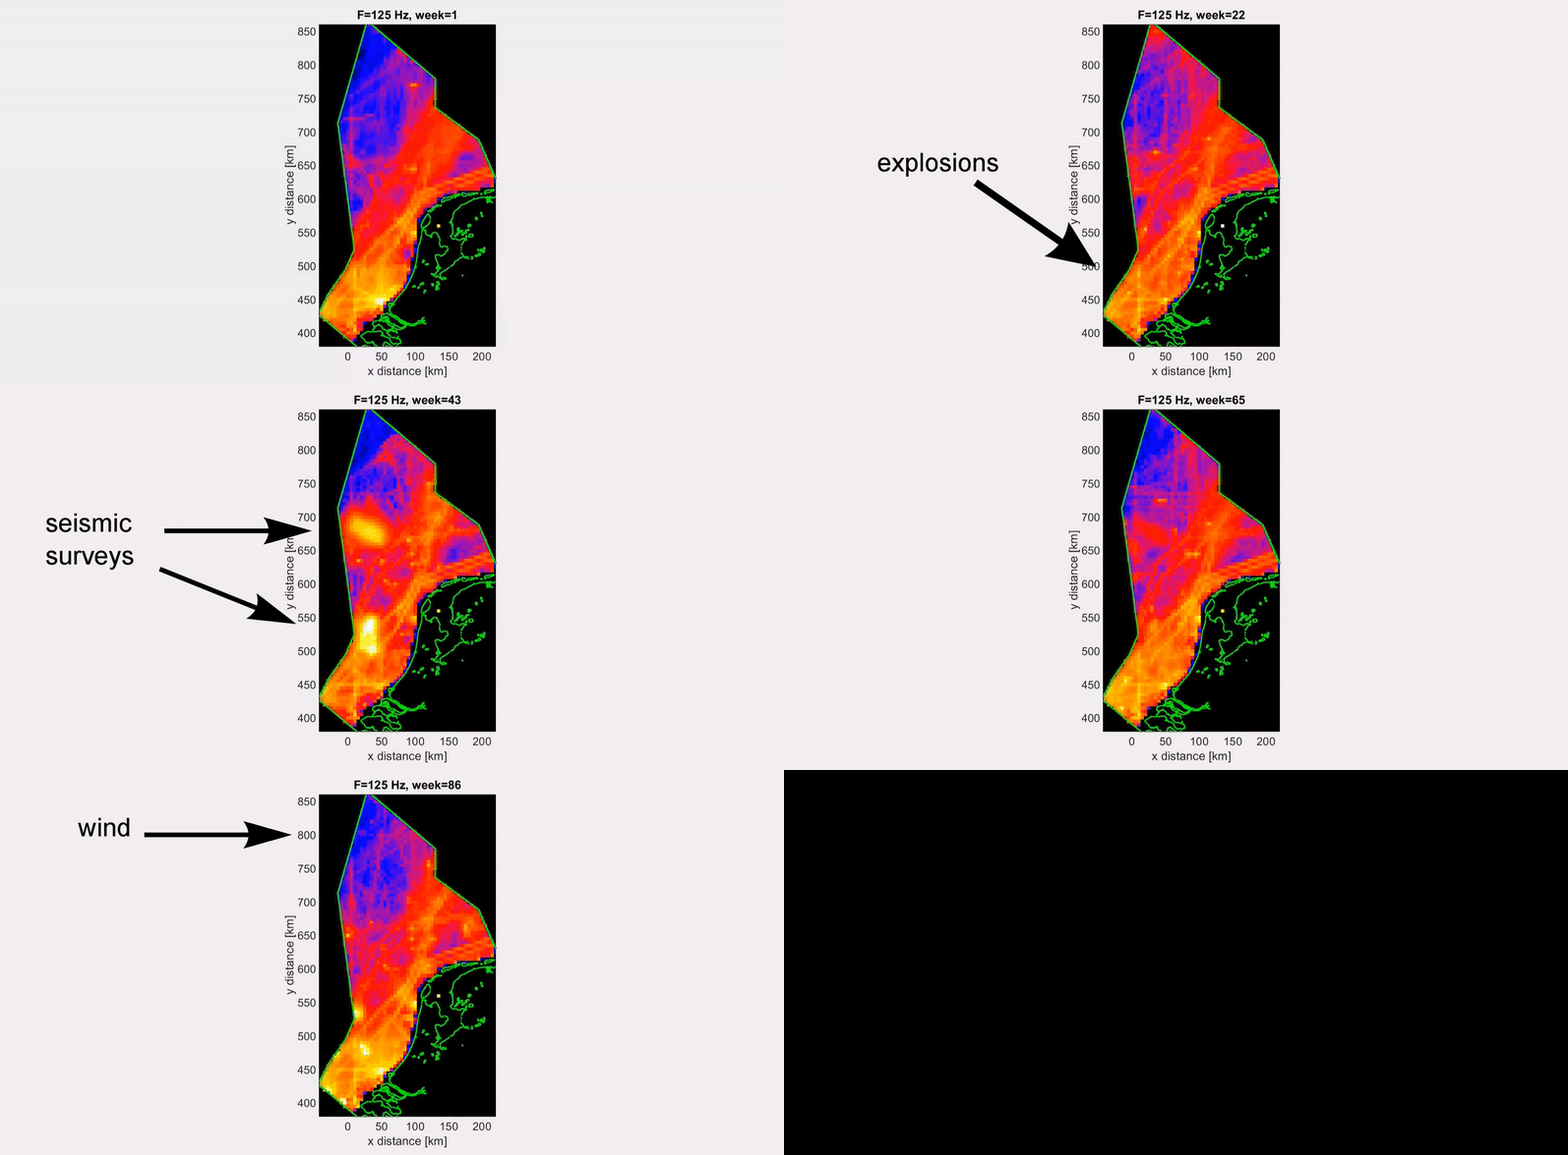
In the following video, the weekly averaged sound maps of the Dutch North Sea are shown for the various sound sources.
Software request form: This software is not available as an open-source yet. It will be announced on the main page when it becomes available.
Feedback/suggestions: If you have any questions, feedback, or suggestion, please contact us with the feedback form or e-mail.
Apostolos Tsouvalas, e:mail: A.Tsouvalas@tudelft.nl
References:
- H.Ö. Sertlek, Aria of the Dutch North Sea, Ph.D. thesis, University of Leiden, 2016, [CrossRef]
- H.Ö. Sertlek, H. Slabbekoorn, C. ten Cate, M.A. Ainslie, Source-specific sound mapping: Spatial, temporal, and spectral distribution of sound in the Dutch North Sea. Environmental Pollution, 2019, 247,1143-1157, [CrossRef].
- H.Ö.Sertlek, M.A. Ainslie, K. Heaney, Analytical and Numerical Propagation Loss Predictions for Gradually Range-Dependent Isospeed Waveguides, IEEE Journal of Ocean Engineering, Volume: 44, Issue: 4, Oct. 2019, [CrossRef].


